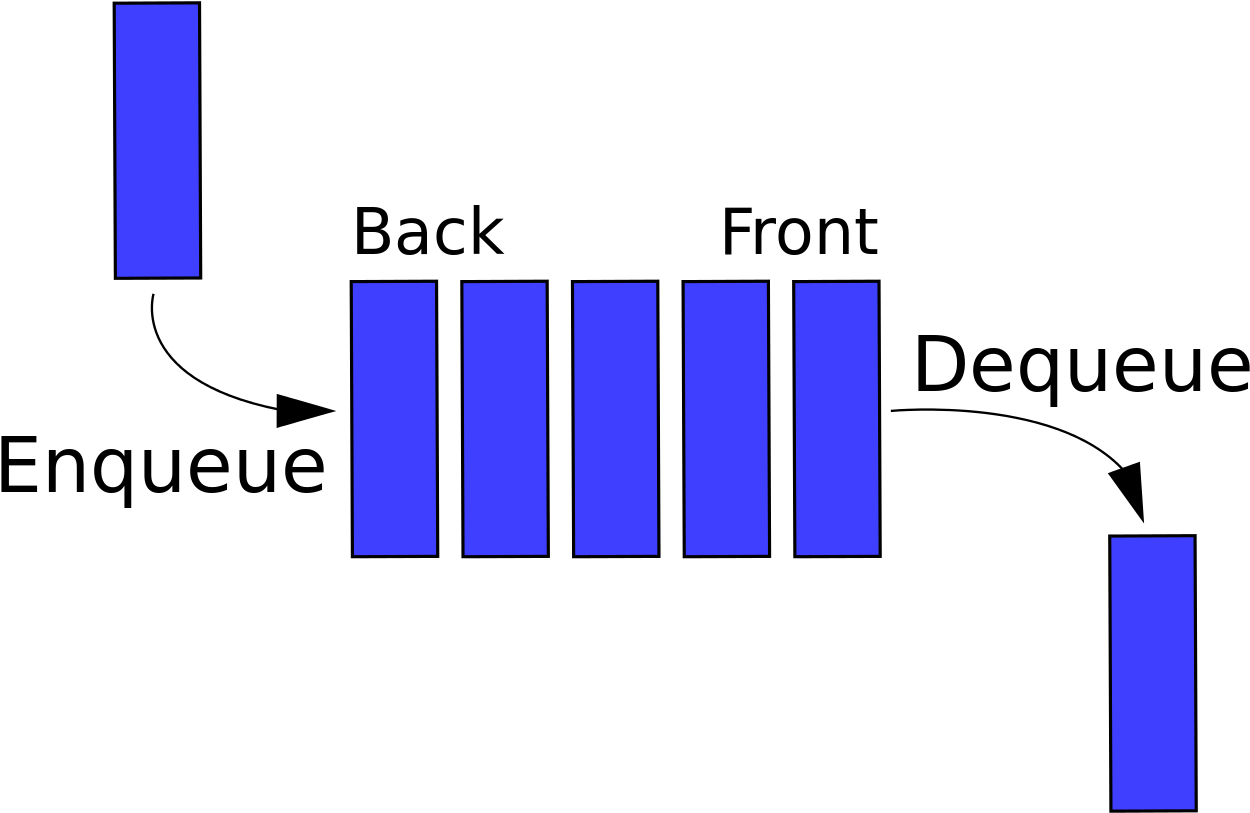
Chart PNG
Browse 322+ Chart PNG as free, transparent downloads
Grab Chart PNG as free, transparent PNGs with hand-trimmed edges. Drop these Chart PNG straight into your designs, stickers, thumbnails and overlays — no background to remove, instant download.

-

Digital analytics dashboard on multiple devices showing user demographics and global data. — Chart PNG -

Digital stock trading wall with colorful financial data and charts — Chart PNG -

3d pie chart with Belarus flag colors and traditional pattern on one slice — Chart PNG -

A glowing digital interface with colorful buttons and distorted text on a gradient background. — Chart PNG -

Wedding statue of bride and groom under floral arch with lanterns and rose petals. — Chart PNG -

Digital network connecting web pages mobile apps global chat and user profiles. — Chart PNG -

Circular diagram showing problem solving steps: Identify Define Explore Action Look back. — Chart PNG -

Circular diagram showing six stages of software development life cycle with colored segments and labels. — Chart PNG -
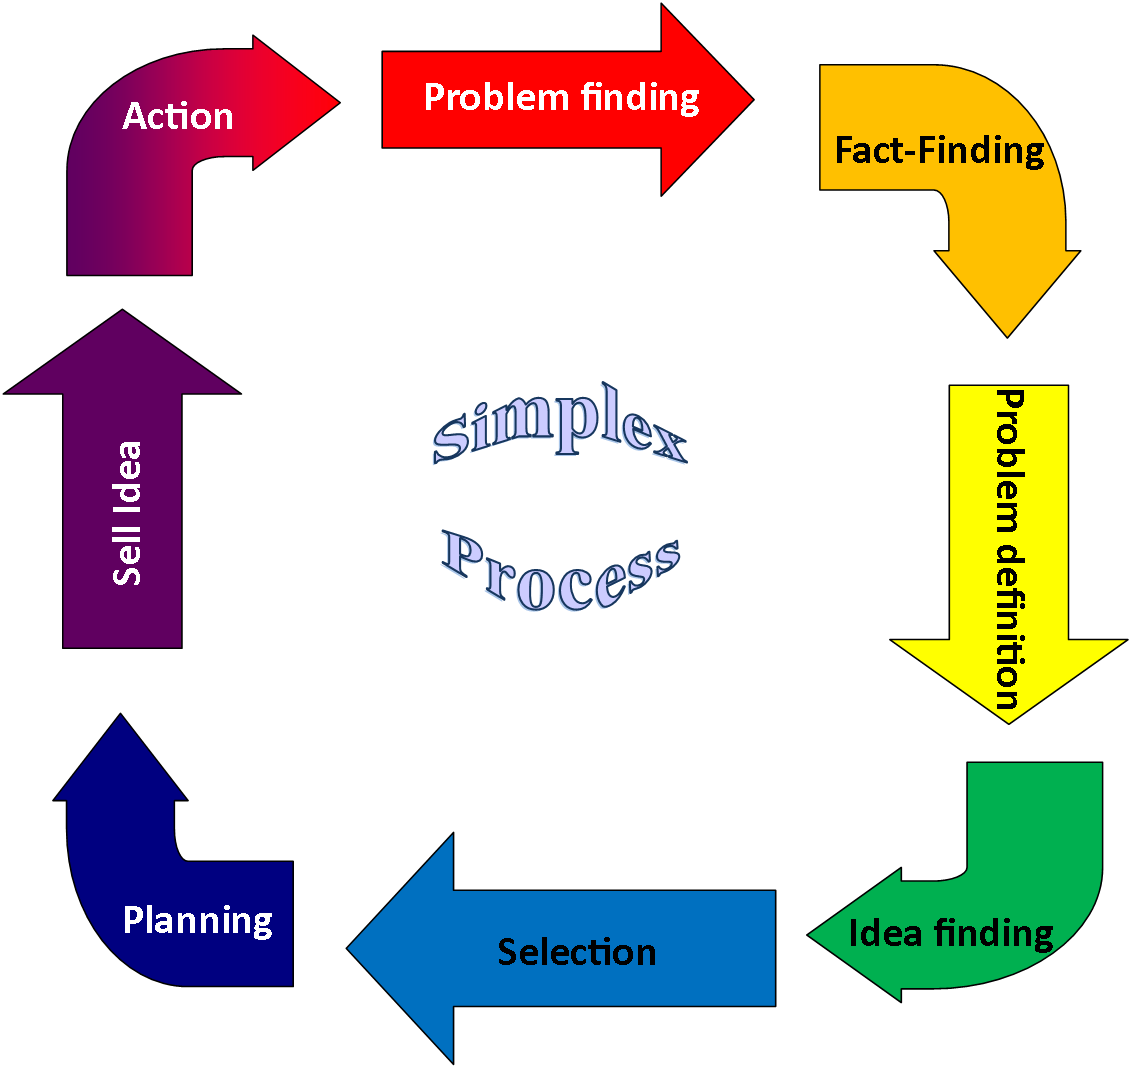
Circular flowchart of the Simplex Process with labeled stages and colored arrows. — Chart PNG -

A detailed financial chart showing stock market data with colorful candlesticks and trend lines. — Chart PNG -

Diagram of an eight-phase design process with feedback loops and central web structure. — Chart PNG -

A colorful 3d bar chart with rainbow hues on a dark background. — Chart PNG -

Symmetrical abstract art with glowing colored rectangles arranged in a radial pattern. — Chart PNG -

Scientific gene interaction network diagram with central red node and branching connections. — Chart PNG -

Futuristic glowing blue digital interface with abstract text and symbols — Chart PNG -

Circular infographic showing various tropical fish and coral species in segmented panels. — Chart PNG -

Diagram of a tire with labels pointing to sidewall text and specifications. — Chart PNG -

Digital screen showing a rainbow graph and two world maps with color-coded data. — Chart PNG -

A colorful digital bar chart showing data trends for May 2023. — Chart PNG -
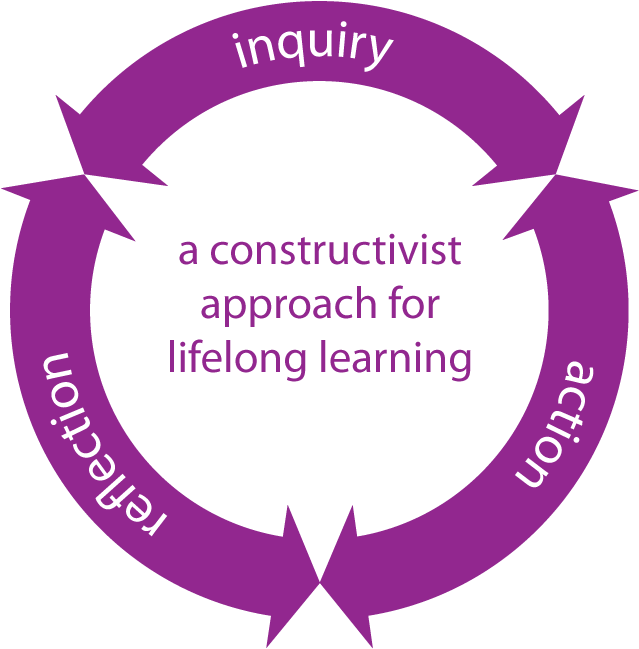
Purple circular diagram illustrating a constructivist approach for lifelong learning with four phases — Chart PNG -
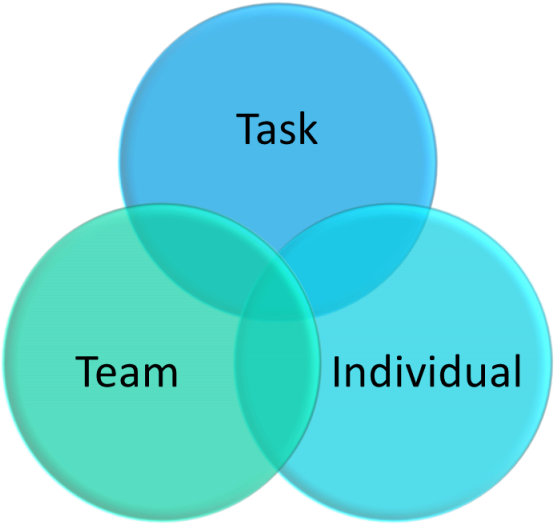
Venn diagram showing overlap between Team Task and Individual elements in blue and teal circles. — Chart PNG -

Educational flash progress chart with colorful blocks and text icons — Chart PNG -
Blue and pink arrows in circular and directional patterns on black background — Chart PNG -

Eight moon phases in grayscale set within a cloud-like border on black background — Chart PNG -

A computer screen showing multiple financial dashboards with garbled text and colorful charts. — Chart PNG -

Robotic hand stacking gold coins with financial charts in background — Chart PNG -

Pure black background with no visible content or details. — Chart PNG -

Six moon phases from full to new displayed in grayscale against black background — Chart PNG -
Abstract digital art with blue rectangles on black background — Chart PNG -

Bar chart comparing Google text ad CTR differences by device and page location in North America Q4 2016. — Chart PNG -

A red and blue line graph showing upward financial trend on black background — Chart PNG -

Temperature graph showing glacial periods and hot cold phases. — Chart PNG -

A leadership pyramid with three levels labeled empower encourage lead teach — Chart PNG -

Futuristic glowing pie charts showing data percentages on a gradient teal background. — Chart PNG -

Scientific graph with blue data points and red green trend lines on black background. — Chart PNG -
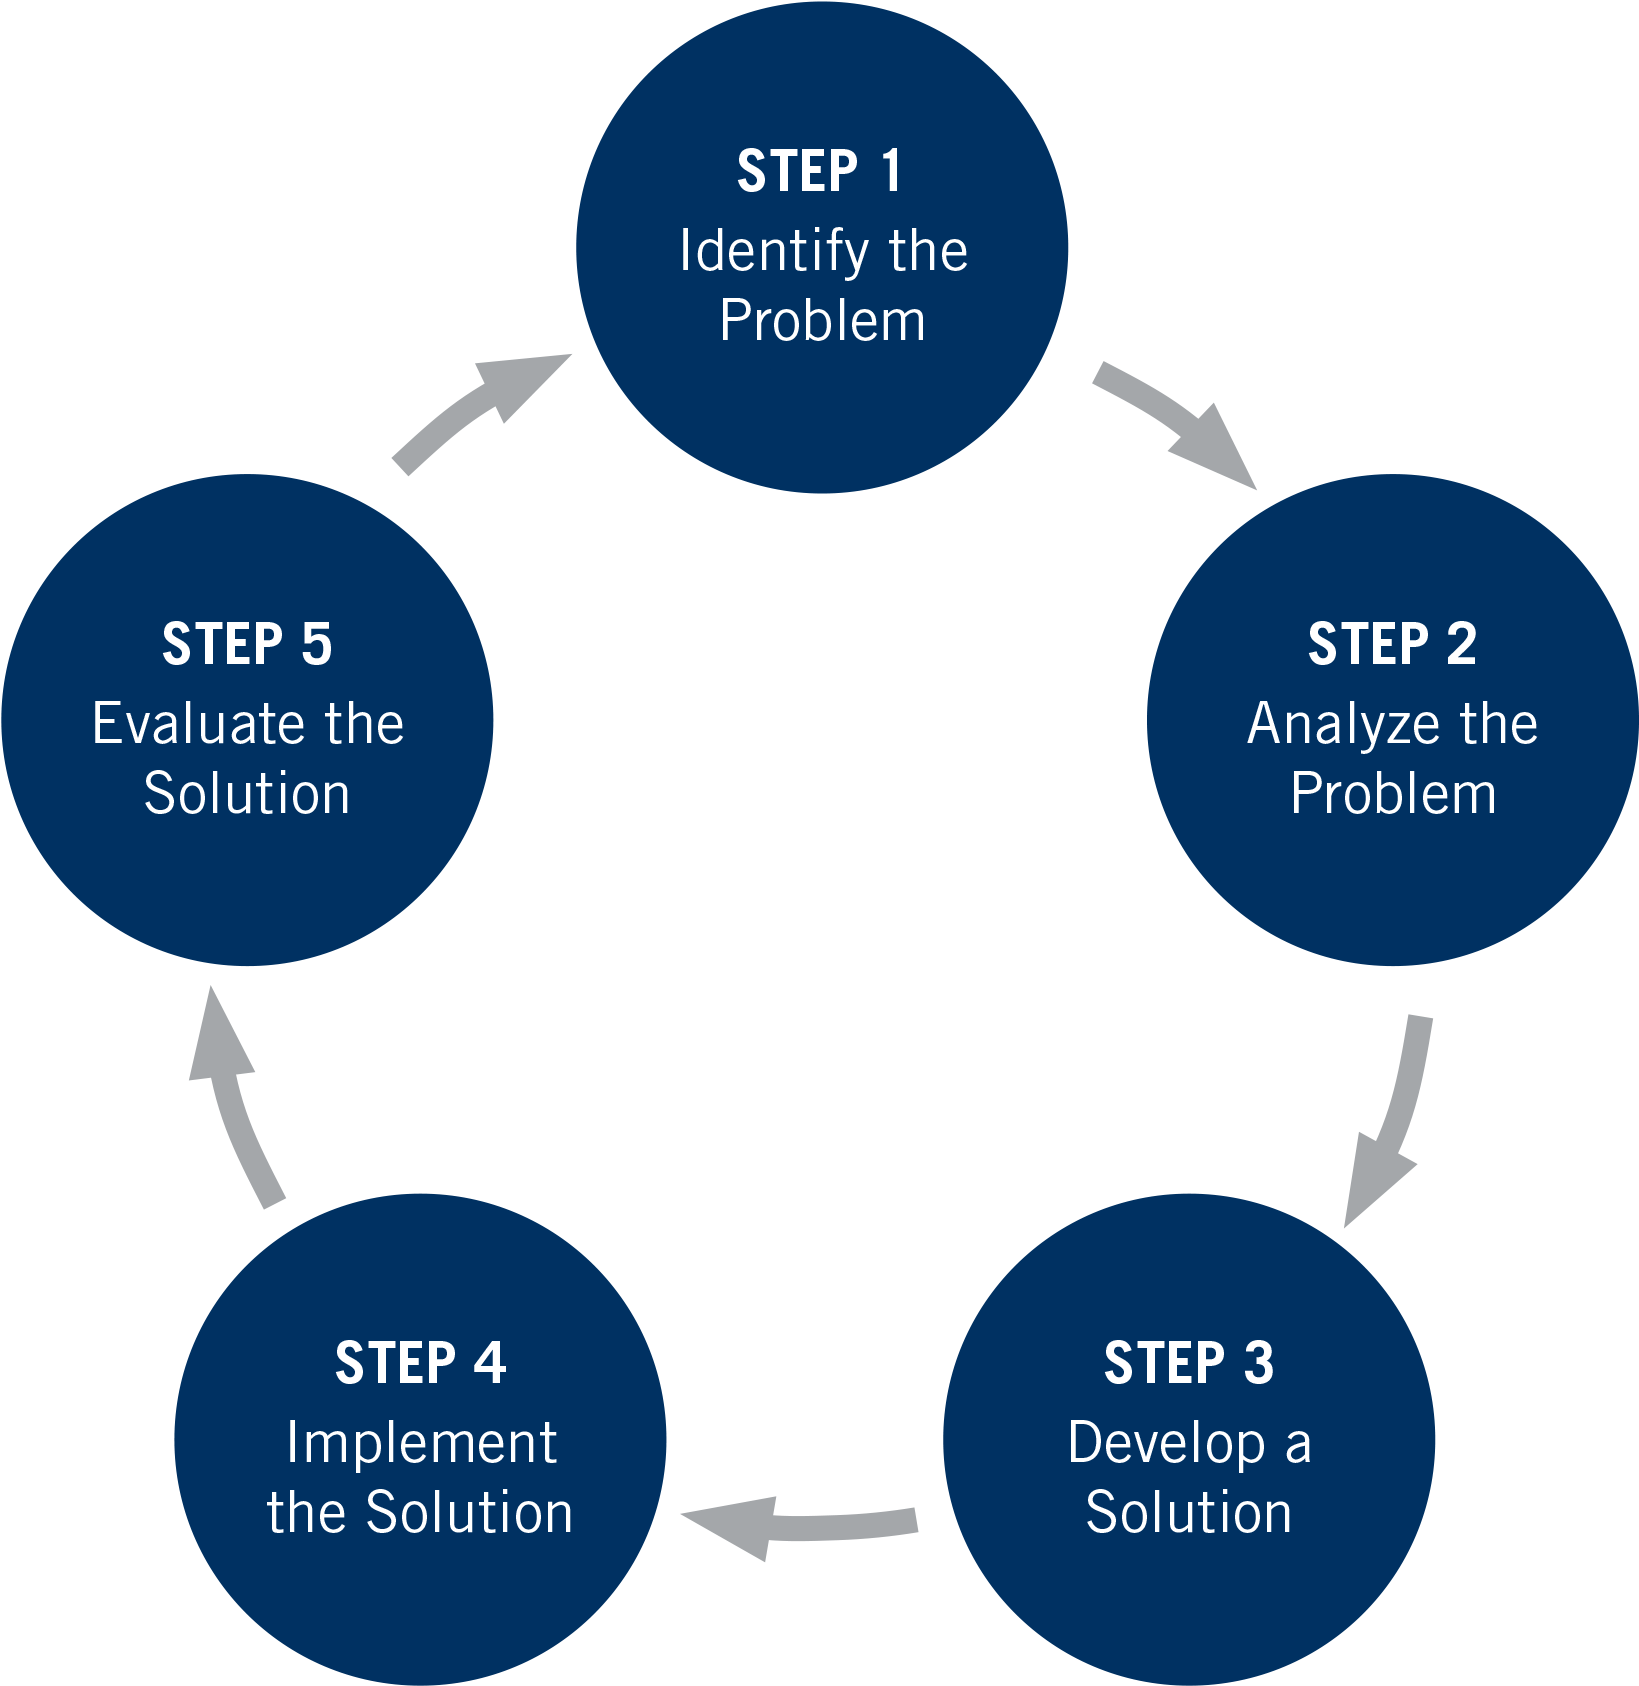
Circular flowchart showing five steps of problem solving with arrows connecting them. — Chart PNG -

Glitchy digital screens with abstract data streams and distorted UI elements in neon colors — Chart PNG -

Six glowing vertical bars with upward arrows and numbers showing growth in a gradient background. — Chart PNG -

Circular diagram showing five steps of data analysis workflow. — Chart PNG -

Pure black background with no visible content or details. — Chart PNG -

Glowing blue world map with red borders and starburst lights — Chart PNG -

Digital marketing workflow infographic with campaigns budget and optimization steps. — Chart PNG -

Glowing neon bar chart with red blue and yellow bars displaying numerical data on a dark background. — Chart PNG -

Futuristic glowing 3d bar chart with colorful translucent bars showing percentages and numbers on a dark background. — Chart PNG -

Infographic displaying marine biodiversity with labeled fish and coral scenes in circular and rectangular panels. — Chart PNG -

Futuristic glowing bar chart with red and blue bars displaying numbers and symbols. — Chart PNG -

A vibrant digital dashboard filled with glowing charts and unreadable text in neon colors. — Chart PNG -

A glowing network diagram with labeled nodes and pipes on a blue background. — Chart PNG -

Cartoon diagram illustrating the water cycle with sun clouds rain mountains rivers and fish. — Chart PNG -

Digital wildlife population dashboard with glowing red and blue charts and icons. — Chart PNG -

Digital stock chart showing investment portfolio performance with blue and green candlesticks on dark background — Chart PNG -

Futuristic digital dashboard with glowing neon charts and graphs on a dark background. — Chart PNG -

Three apartment buildings with colorful roofs next to a rising 3d bar graph on a grid. — Chart PNG -
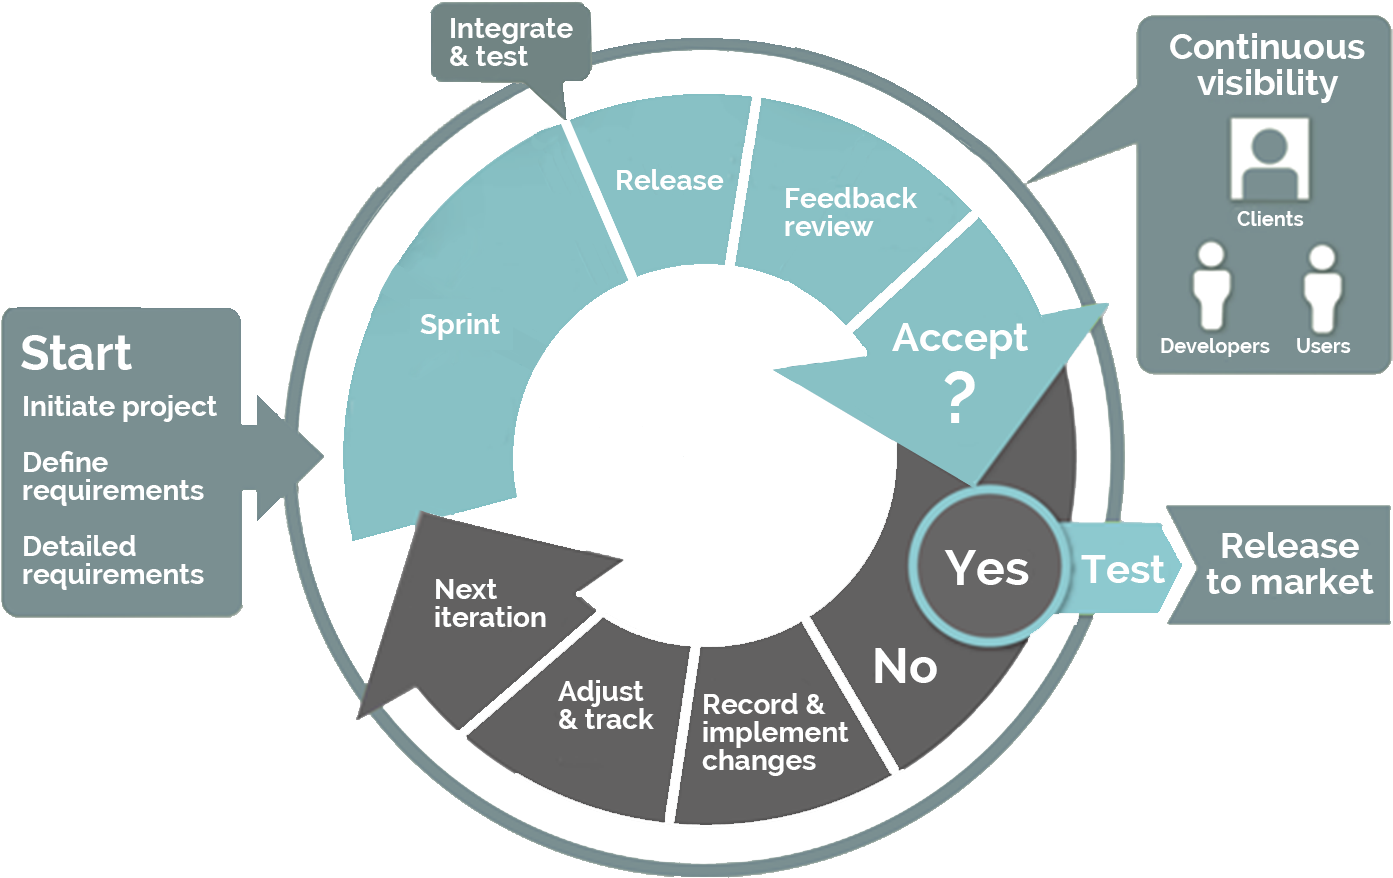
Salpo Agile Methodology workflow diagram showing iterative development and feedback loops. — Chart PNG -

Advertising account structure diagram with campaigns ad groups keywords and ads. — Chart PNG -

A glowing blue 3d bar chart with white neon numbers and labels. — Chart PNG -

Advertising performance chart with user avatars and ranking metrics. — Chart PNG -

A glowing green 3d world map on dark blue background — Chart PNG -
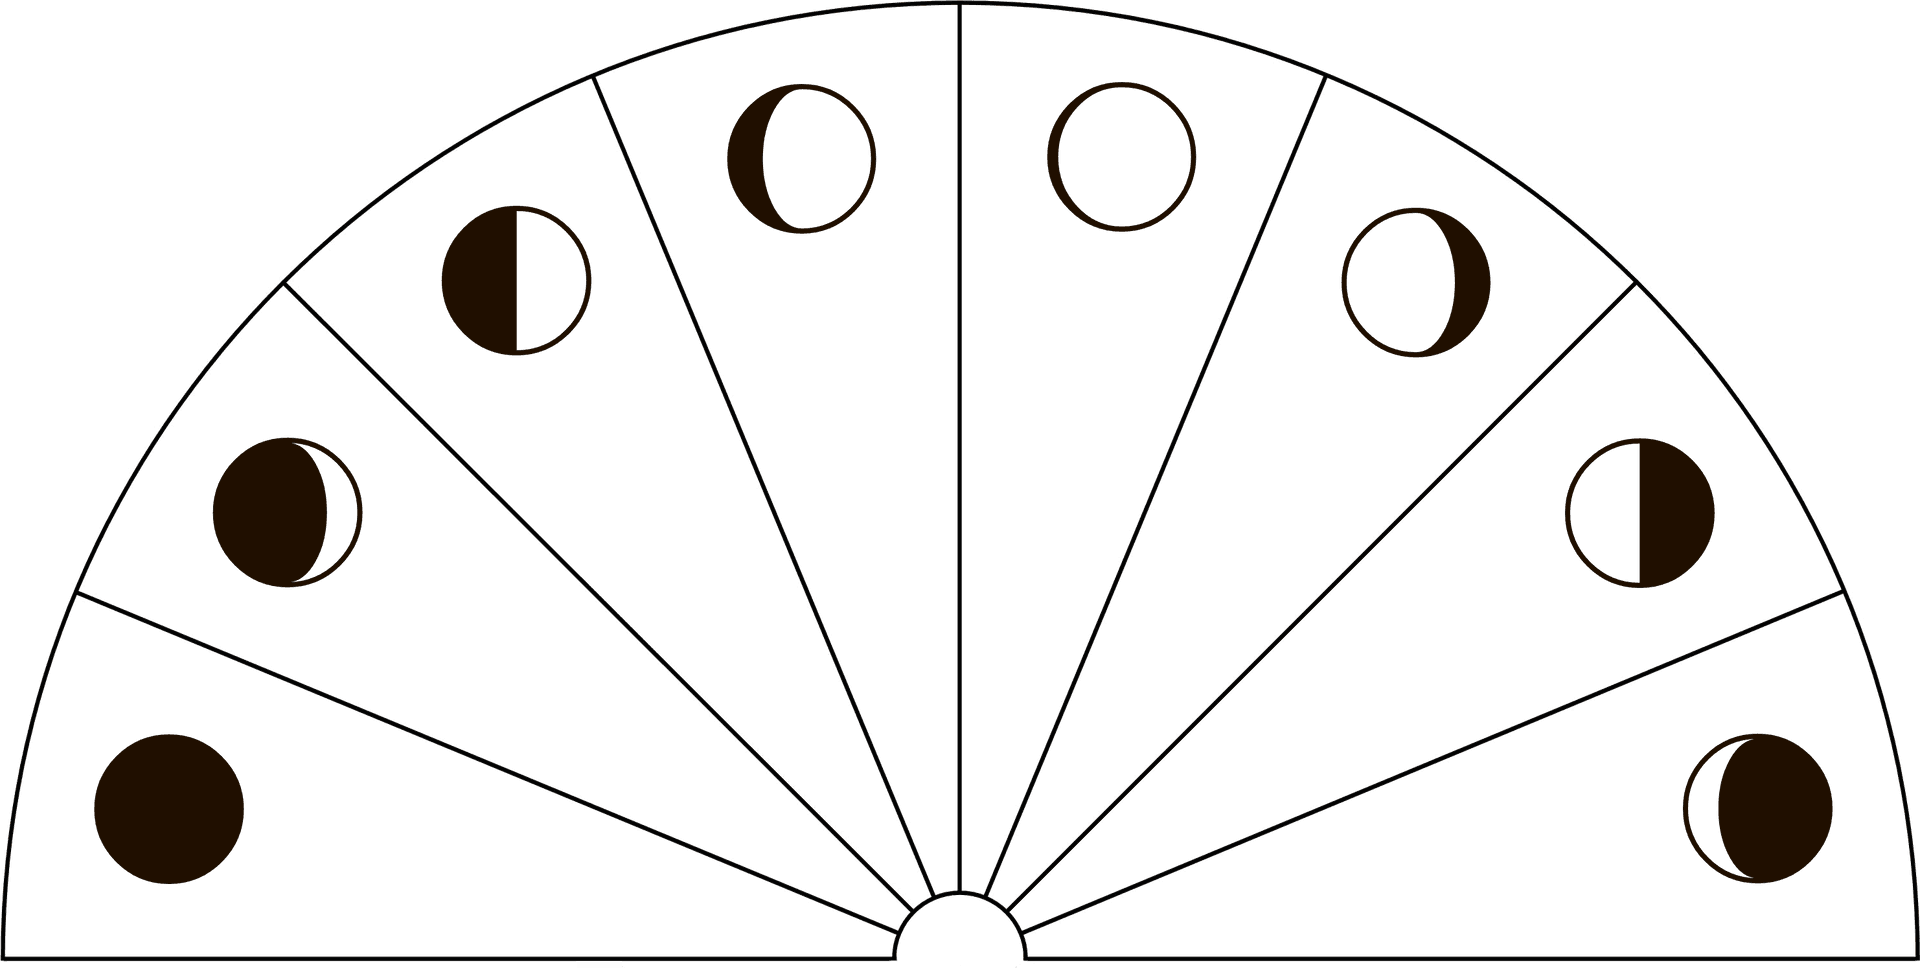
Diagram illustrating the lunar phases in a semi-circular arrangement. — Chart PNG -

A colorful cartoon food pyramid showing different food groups with illustrated items. — Chart PNG - Next page
Showing 1–60 of 322 wallpapers